Website translated by google translator. May contain linguistic errors.
Works
STATISTICAL PIXELS series (since 2022)
PROCEDURAL ANIMATIONS (2016 to present)
STATISTICAL PIXELS series (since 2022)
Statistical Pixels Series (since 2022)
The works are inspired by the social behavior of people, described by statistical data, as well as by various ways of visualizing them. The form of my paintings in this series is based either on pixels (heatmaps) or on juxtaposing, mixing, colliding, and merging pixels with other statistical diagrams.
DENDRO & HEATMAP series (since 2021)
PROCEDURAL ANIMATIONS (2016 to present)
STATISTICAL PIXELS series (since 2022)

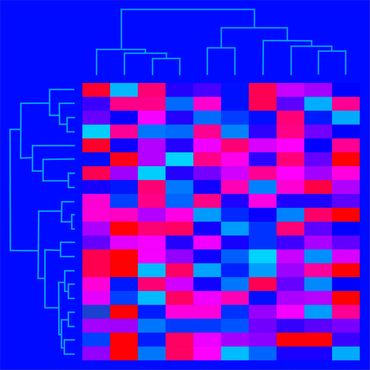
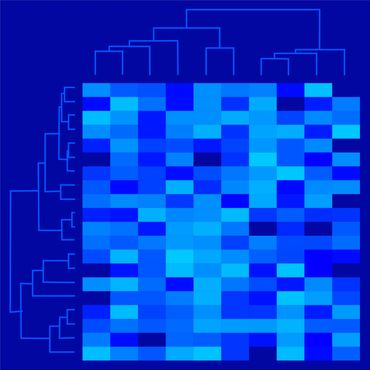
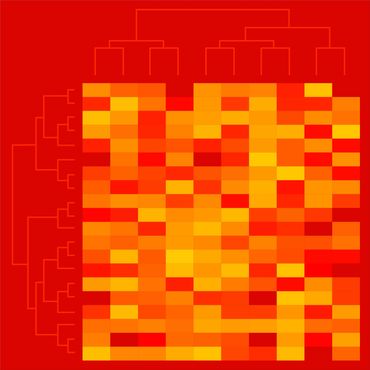
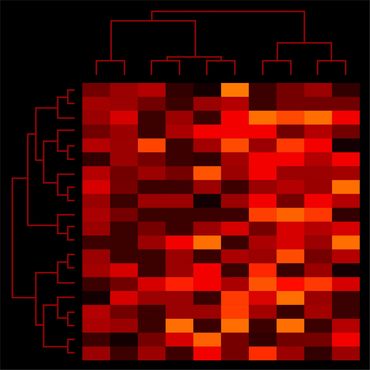
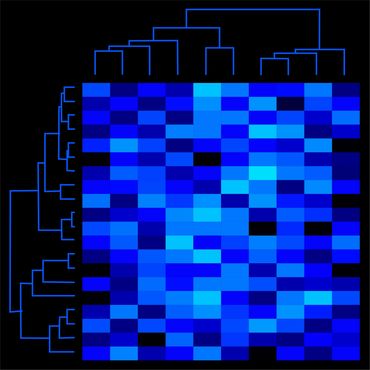
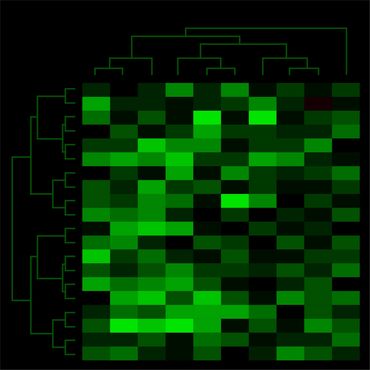
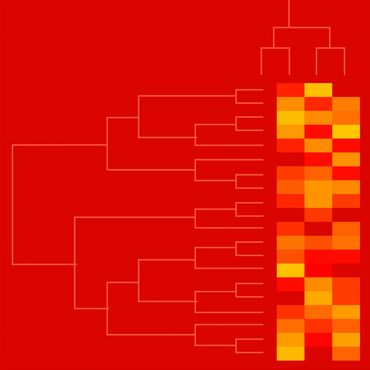
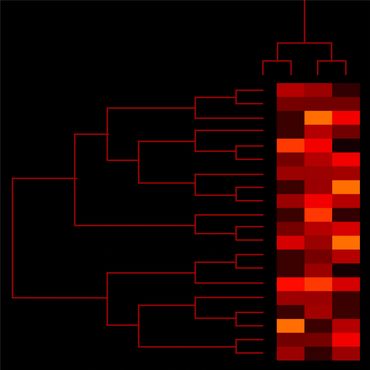
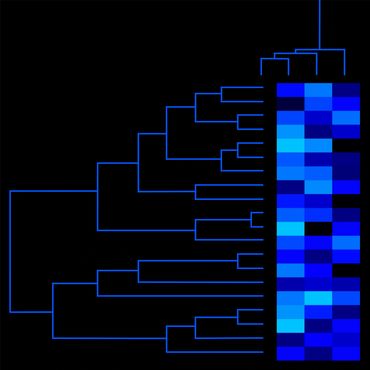
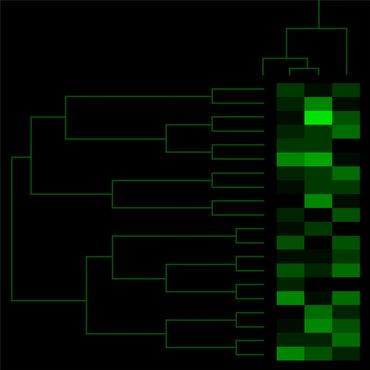
Dendro & Heatmap Series (since 2021)
The works are inspired by the phenomenon of the so-called hot points of view related to human perception of reality and prioritizing visual information.
The cycle title refers directly to the tree diagram and the color temperature that I obtain using cables.gl software for data visualization.
PROCEDURAL ANIMATIONS (2016 to present)
PROCEDURAL ANIMATIONS (2016 to present)

Procedural animations (since 2016)
The inspiration for the first version of the animation is always data related to people's social behavior. Successive versions of the animation are based on pseudo-random numbers generated by the computer in real time and simultaneously illustrated, according to the procedure created in the Processing program.
STATISTICAL JETS series (2013 to present)
MAPPING OF CIVILIZATION series (2008 to present)

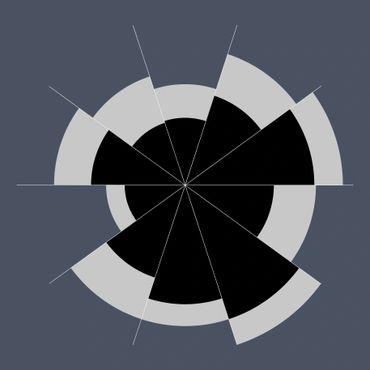
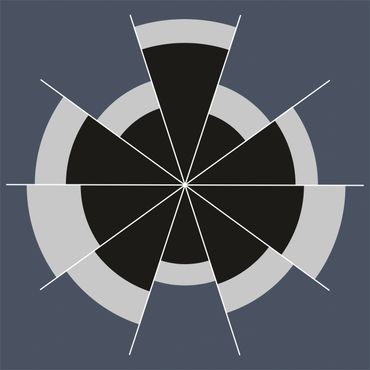
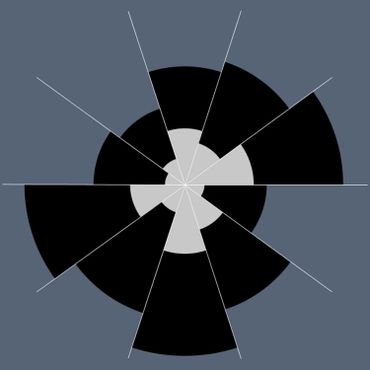
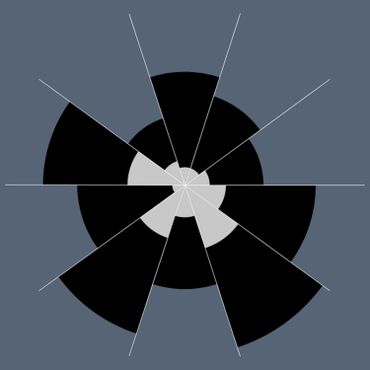
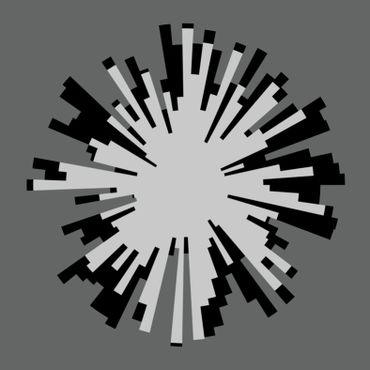
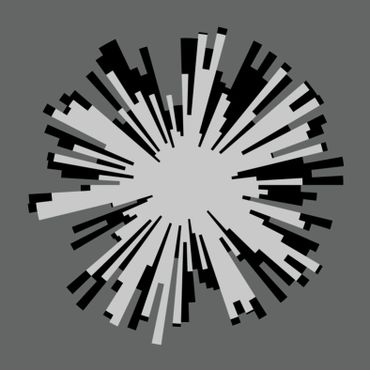
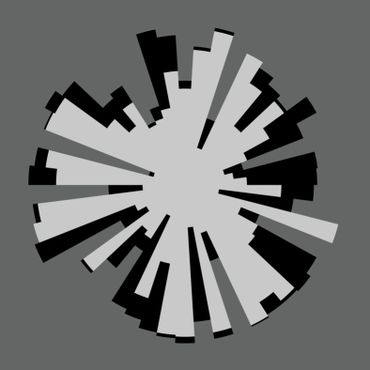
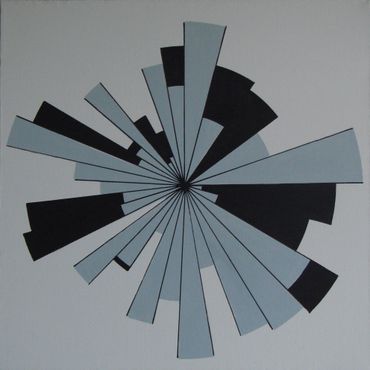
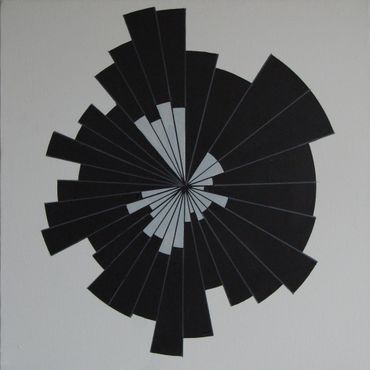
Statistical jets (since 2013)
"Statistical jets" is the conventional name of statistical images, paintings and digital graphics, the form of which I based on the wind rose chart. The inspiration comes from data related to people's social behavior.
MAN AS A DATABASE series (2010 to present)
MAPPING OF CIVILIZATION series (2008 to present)
MAPPING OF CIVILIZATION series (2008 to present)

Man as a database (2010 - present).
In the world of ubiquitous digital databases, I have treated people as databases. I create paintings on canvas that map 10 facts from the life of an interactor, who are usually friends and people of art: artists, curators, critics. I also create tracing drawings, which map 10 important places for interactors, who are usually people, students or visitors to galleries, who are usually met by chance. I chose the number 10 as the universal Pythagorean number.
MAPPING OF CIVILIZATION series (2008 to present)
MAPPING OF CIVILIZATION series (2008 to present)
MAPPING OF CIVILIZATION series (2008 to present)

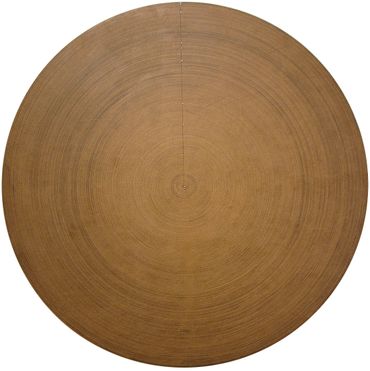
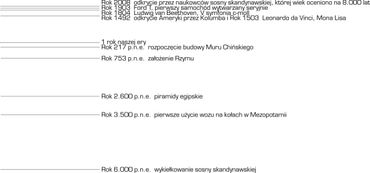
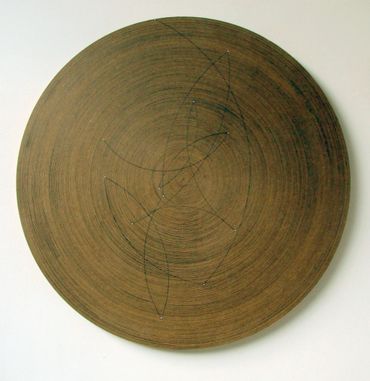
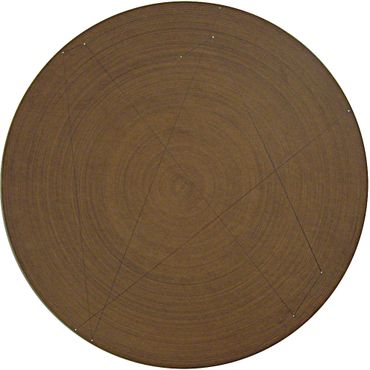
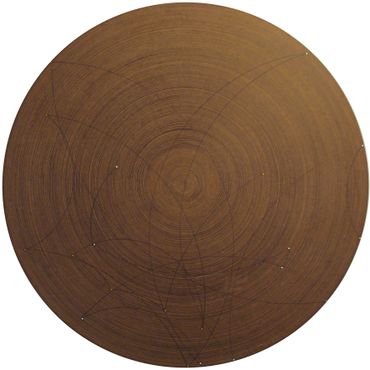
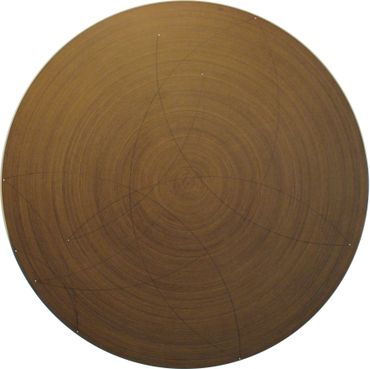
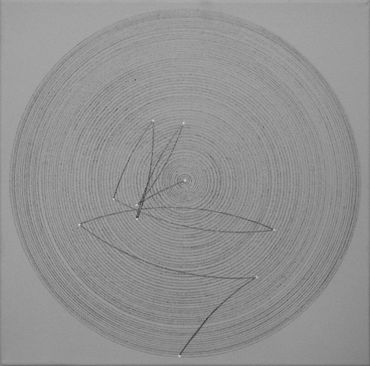
Mapping of Civilization (2008 - present).
The inspiration was the discovery of Scandinavian pine, estimated to be 8,000 years old. This fascinating discovery shows that mute witnesses to much of human history are still alive. On the drawing patterns resembling tree rings, I mark randomly selected events from the history of Civilization.
PICTURES & PLACES series (2004-2008)
STATISTICAL PICTURES series (1999 to present)
STATISTICAL PICTURES series (1999 to present)

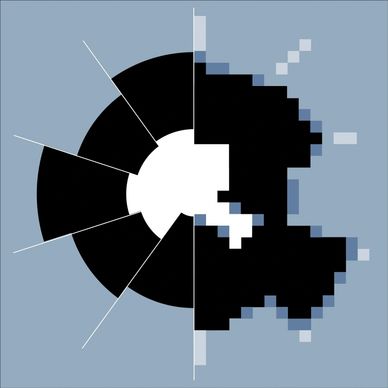
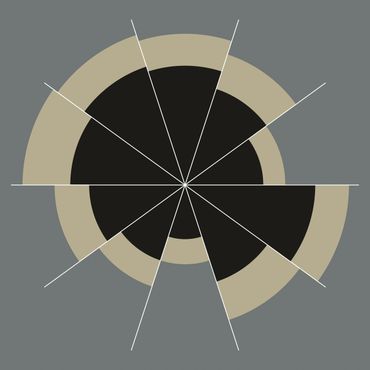
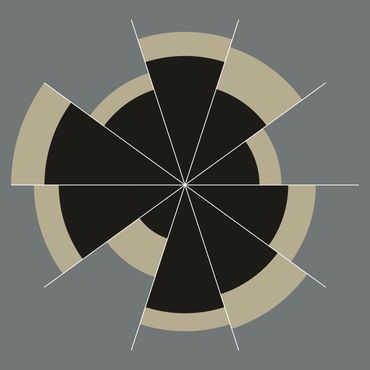
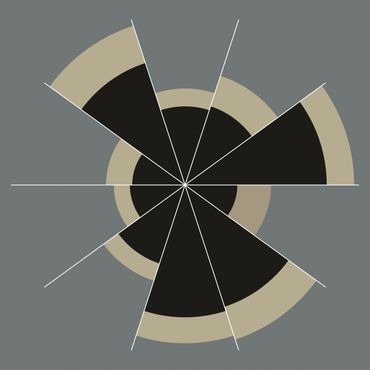
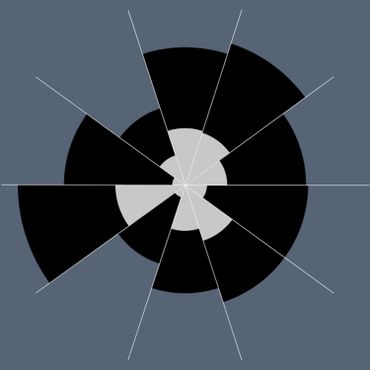
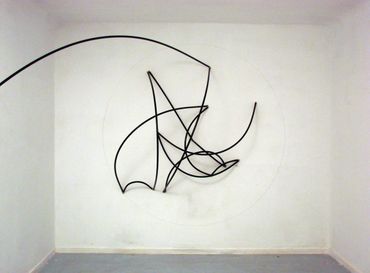
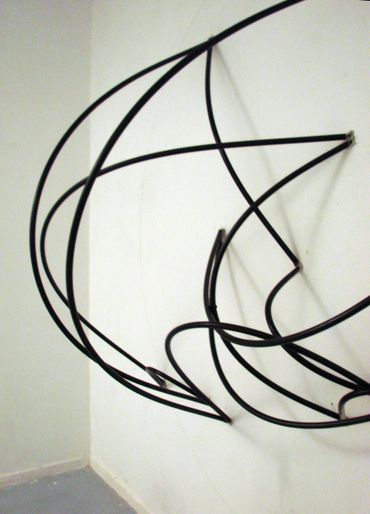
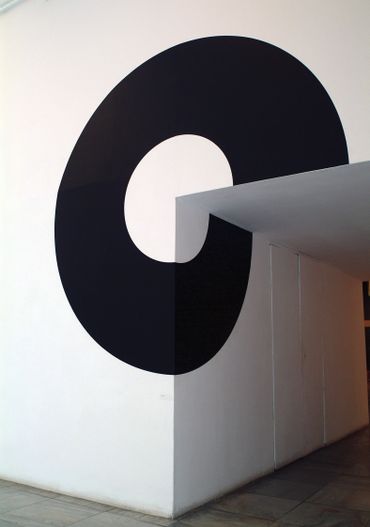
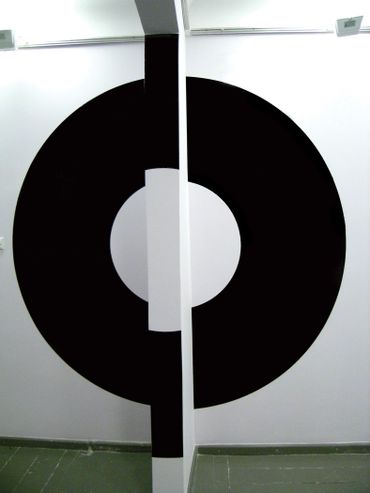
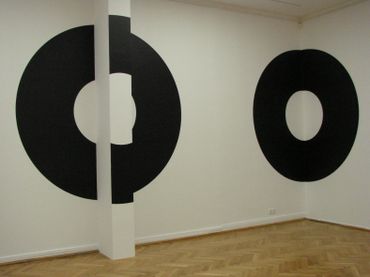
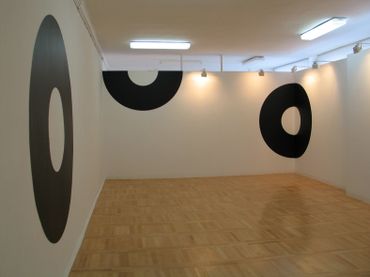
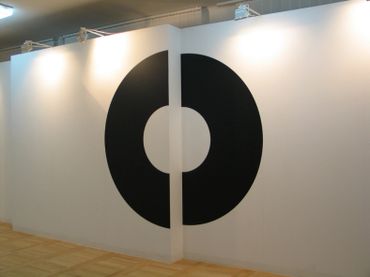
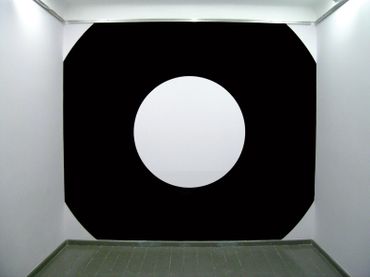
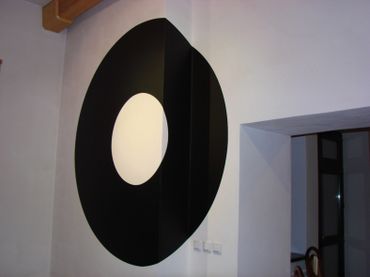
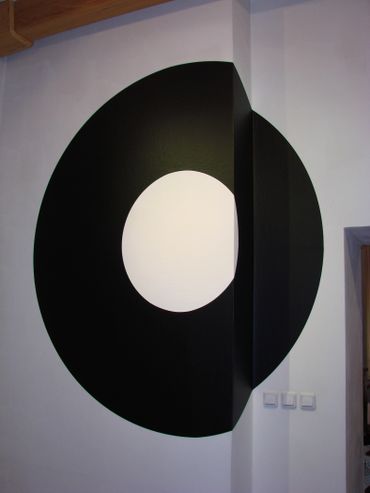
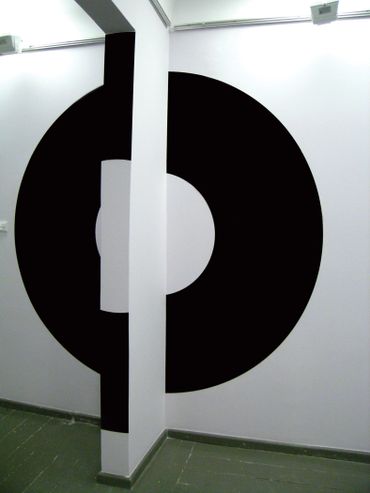
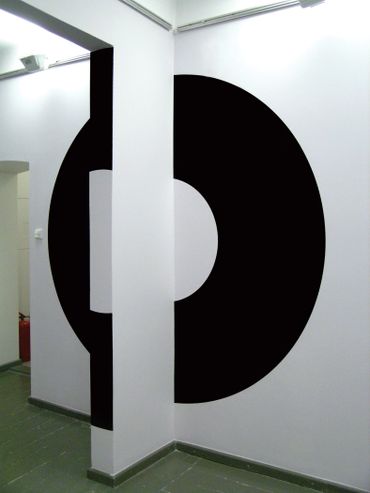
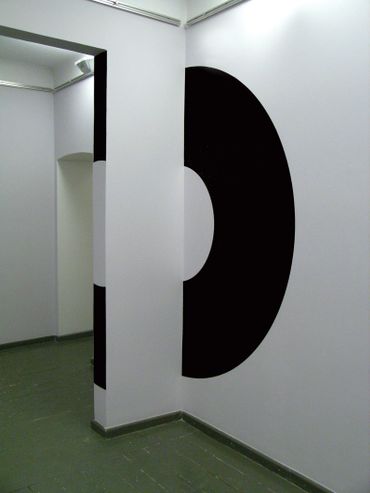
Pictures and places (2004-2008)
This cycle is a continuation of considerations on the relation of a work of art to the place of its exhibition. The black circle symbolizes the work, the form of which depends on the shape of the architecture in which the circle is placed.
STATISTICAL PICTURES series (1999 to present)
STATISTICAL PICTURES series (1999 to present)
STATISTICAL PICTURES series (1999 to present)

Statistical images (a series carried out since 1999). From January 1999, statistics became the area of my interest and my main inspiration. As part of this series, I create paintings on canvas and wood, digital graphics, installations and wall interventions in interiors. The two main work cycles are: "Threats", the cycle concerns global threats to people and their environment; and "Statistical Pole", the series mainly concerns the social behavior of Poles, their attitude to the death penalty, gender, religion, affluence, old age, health behavior and ecology.
DESIGNATING A PLACE series (1992-1998)
STATISTICAL PICTURES series (1999 to present)
DESIGNATING A PLACE series (1992-1998)

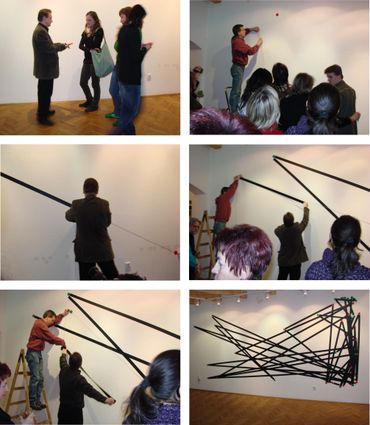
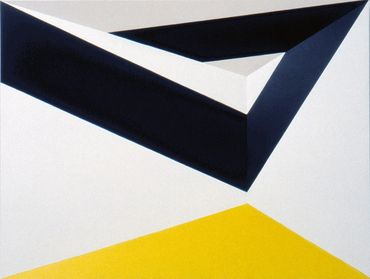
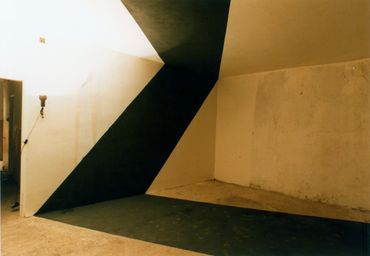
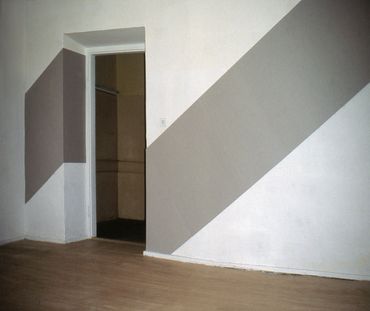
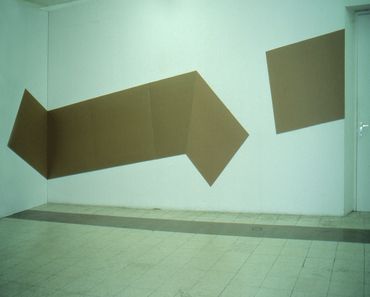
Designating the place (1992-1998)
Following the thought of Daniel Buren that the form of a work of art depends on the place of its presentation, I began experimenting with designating non-standard exhibition places for works of art. I created reliefs that were at the same time models of imaginary interiors. I also made wall projects using non-standard places for paintings, such as the joints of walls, walls and ceilings, walls and floors.
DRUMHELLER series (1999-1988)
DYNAMICS OF LINES series (1985-1988)
DESIGNATING A PLACE series (1992-1998)
The series was carried out in 1988-1999.
The inspiration was the so-called the badlands, exposed tectonic strata and the coloring of Horseshoe Canyon, in the Red Deer River Valley (Alberta, Canada). The name of the cycle comes from the town of Drumheller, to which part of the Red Deer River Valley belongs, often referred to as the Dinosaur Valley.
TRITICUM series (1988-1991)
DYNAMICS OF LINES series (1985-1988)
DYNAMICS OF LINES series (1985-1988)

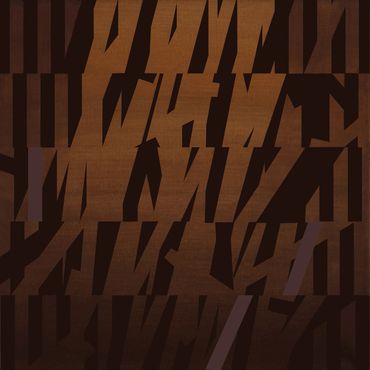
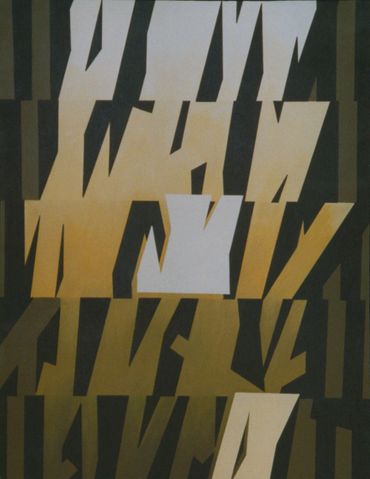
TRITICUM. The series was carried out in the years 1988-1991. Triticum (Latin wheat). The works are inspired by the vertical rhythms of the stems and oblique rhythms of wheat leaves, their movement in the wind, the waving of the grain field, changing flashes of light, which ultimately lead to considerations on composition divisions, visual balance or hierarchy of elements and their repetitions.
DYNAMICS OF LINES series (1985-1988)
DYNAMICS OF LINES series (1985-1988)
DYNAMICS OF LINES series (1985-1988)

The series was carried out in 1985-1988.
The paintings are inspired by the optical illusion of Poggendorf, in which we always see a diagonal line on horizontal lines as a set of shifted sections. This cycle developed from simple patterns to visually complex compositions and ultimately inspired by common reed, its varying densities and water reflections.
STATISTICAL PIXELS series (since 2022)


Dendro & Heatmap Series
STATISTICAL JETS series (2013 to present)

STATISTICAL IMAGES / (a series carried out since 1999)


Człowiek jako baza danych (2010-obecnie)


MAPPING OF CIVILIZATION / 2008 to present

Pictures and places (2004-2008)
Designating a place (1992-1998)


DRUMHELLER / 1988-1999


TRITICUM (1988-1991)